Actionable Analytics
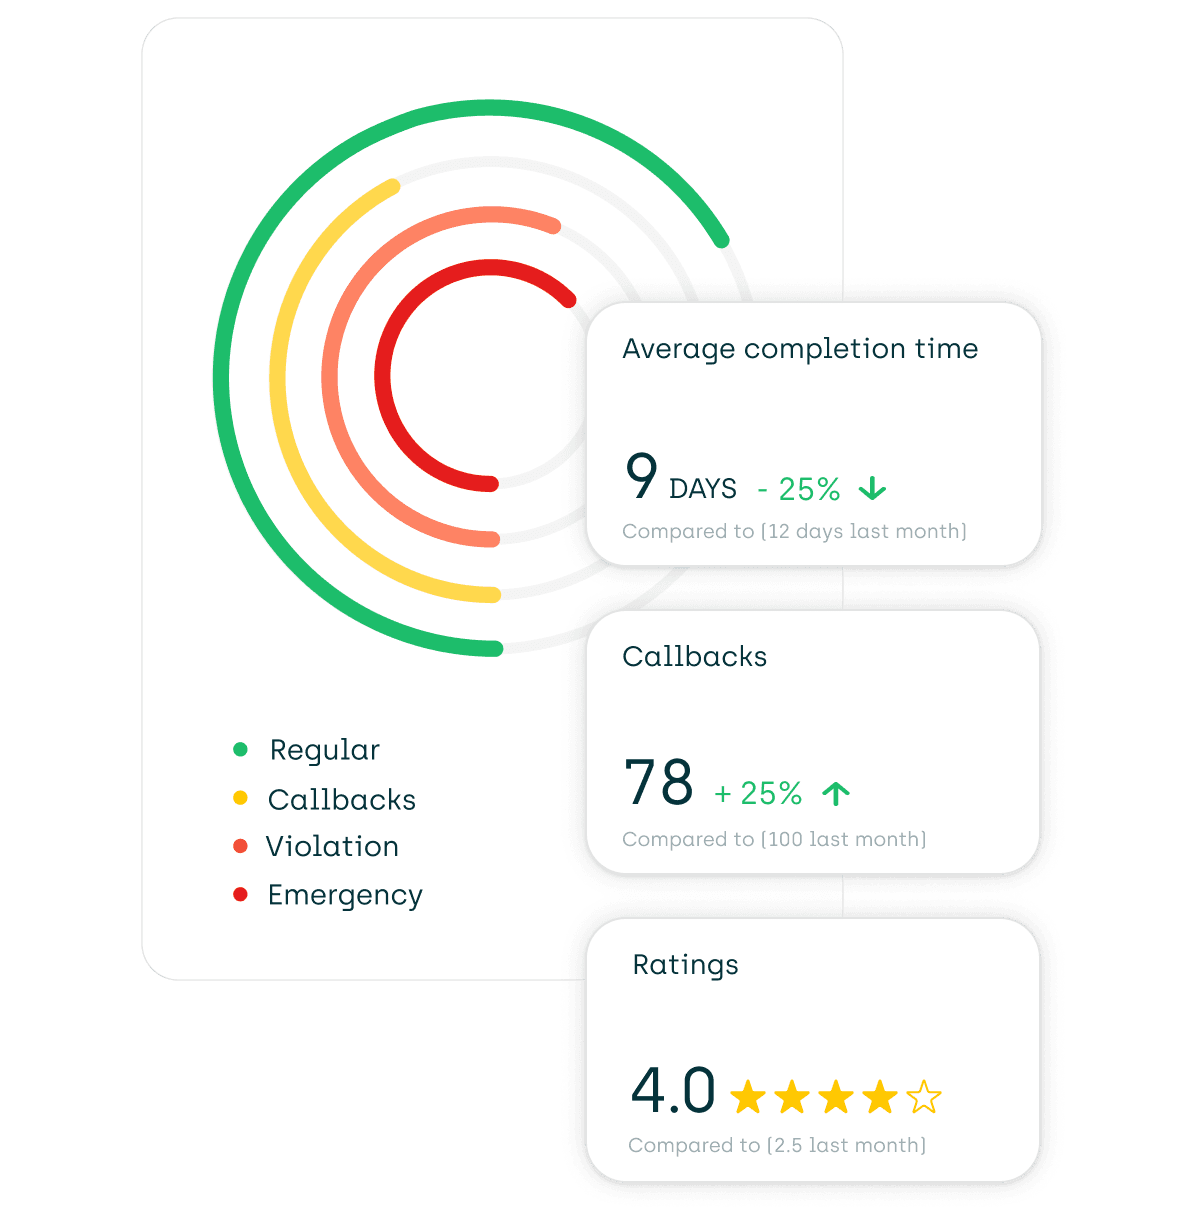
Make faster, data-driven maintenance choices with AppWork’s real-time dashboards; built by decision-makers to help your daily decision making.

Make Data-Driven Decisions
Stop guessing and start knowing. Make decisions based on real-time data.

Get a quick overview of a property's performance. Dig deeper with a single tap.
Use our date filter to see the bigger picture and gain a broader understanding of current trends.
Use our property filter to see all the statistics for one property or a portfolio of properties, enabling regional comparisons.
Easily compare current KPIs with data from the previous week, month, or year.
We collect hundreds of data points every day based on the real-time activity of your team. Then we turn all this data into actionable insights.
Pinpoint Opportunities for Growth
Get a quick overview of technician performance. See who's performing well, and in which categories they excel.

See real-time data about open work orders and the current completion rate.
You can compare technicians side-by-side, from one or more properties.
Forecast future maintenance needs and build custom schedules to fulfill those needs.
Eliminate Obstacles
Do certain issues plague your operations? Aggregate data from current and previous work orders to find lasting solutions.

With a glance, you can see your average turnover time and your work order saturation level.
Receive automated emails about technicians missing work or lacking assignments.
Customize your analytics dashboard to maximize growth with better management.
Automatically push important data to stakeholders and managers.
Revolutionize Insights with Interactive Property Maps
Transform your property management with our Interactive Property Maps. Visualize work orders and operational data with our advanced heat maps. Apply custom filters to gain new perspectives and make data-driven decisions with ease. See your property like never before and streamline your operations.

Advanced Heat Maps: Easily visualize work order data across your property.
Custom Filters: Apply advanced filters to focus on the data that matters most.
Data-Driven Decisions: Gain new insights and streamline your property management processes.
Try our Analytics for Free


